48uep6bbphidcol2|ID
48uep6bbphidvals|1869
48uep6bbph|2000F98CTab_Articles|Fulltext
Introduction
Crohn’s disease (CD) is a chronic inflammatory bowel condition that is characterized by transmural inflammation of the bowel, leading to erosions, ulceration, and sometimes inflammatory or fibrotic stenosis. Enteric sinuses and fistulae and abscess collections are complications of penetrating disease. The European Crohn’s and Colitis Organisation (ECCO) recently published a revised consensus on the diagnosis and management of CD.2 It recommends either computed tomography (CTE) or magnetic resonance (MRE) enterographyas standards for assessing the small intestine. Both these modalities can identify inflammatory, penetrating andstricturing disease. A recent study showed that MRE significantly increased the confidence of clinicians for the presence or absence of small bowel disease and changed therapeutic strategy in 61% of patients.3 In India the use of MRE is increasing but CT scan is still preferred. With MRE, the availability, radiologist’s familiarity, the cost and time taken are the issue where as radiation and cost are the issues with CTE.
The following issues need to be addressed while evaluating an imaging modality in CD: (1) safety of the modality, especially where repeated imaging may be necessary and (2) its ability to accurately determine extent of small and large bowel involvement, distinguish active inflammatory from fibrotic stricturing disease, recognize extramural complications, and detect recurrent disease following surgery. There could also be subjective variations amongst radiologists in reporting these findings. An objective scoring system is therefore preferable for maintaining uniformity in reporting.4-7 Girometti
et al.12 showed that a scoring system (MRI severity index) comprising various MRI findings had diagnostic accuracy of 91%, sensitivity of 93% and specificity of 87% in evaluation of inflammatory disease activity in CD.
We addressed these issues in this retrospective analysis of data of patients with CD who underwent both CTE and MRE.
Subjects and Methods
This was a retrospective analysis of patients with CD seen in the Division of Gastroenterology who underwent both CTE and MRE (within a span not exceeding a week of each other) over 2 years (2014-15). In 29 consecutive patients with Crohn’s disease, CTE andMRE were done (within 4 weeks of each other) to assess involvement of small bowel. The protocol was approved by the institution’s ethics committee (project number1078-17-DD). CTE and MRE were evaluated by a single radiologist (NM) who was aware only of the diagnosis of CD but not of clinical and laboratory details. Active disease was defined as presence of symptoms (Abdominal pain or diarrhoea)and positive inflammatory markers; the latter included C-reactive protein (CRP) and fecal calprotectin (FC). CRP > 6 mg/Land FC >50 ?g/g were considered abnormal as per our laboratory reference standard.
MR severity index12 was calculated based on MR findings(Mentioned subsequently)
CTE Protocol
CTE was performed using a helical 64-MDCT system (Light Speed Pro, GE Healthcare, United Kingdom). A neutral enteric contrast agent (mixture of mannitol,edible gum and water; 1500 mL) was administered orally in aliquots at 60, 45 and 30 minutes before the scan. At 15 min before the scan, participants were given 500 mL of water. Immediately before scanning, patients were given 0.5 mL hyoscine butylbromide (Buscopan®; Boehringer Ingelheim) intravenous over 30 seconds. Contrast-enhanced CT was performed with the following settings: 310 mA, 120 kVp, 0.5-second tube rotation time, detector configuration 16 × 0.625, pitch 0.9375. The IV contrast (150 mL iohexol [Omnipaque 300, GE Healthcare]) was injected at 4 mL/s, and scanning was initiated after a 50-s delay.8 Images were obtained with 2.5-mm section thickness at intervals of 1.25 mm. Overlapping 2 mm coronal images were reconstructed from overlapping 1.25 mm slices.
MRE Protocol
MRE was performed using a 1.5-T magnet (Philips, Netherlands). Patients were scanned in the supine position with a 16-channel torso array coil using the following protocol: coronal single-shot fast spin-echo (SSFSE) (TR/TE 2,000/90; matrix size 256 × 256; slice thickness 5 mm; gap 0 mm), coronal 2D true fast imaging with steady-state precession (FISP) (matrix 193 × 340; slice thickness 5 mm; gap 0 mm), axial SSFSE (2,000/90; matrix 256 × 256; slice thickness 6 mm; gap 0 mm), axial 2D true FISP (matrix 192 × 340; slice thickness 6 mm; gap 0 mm), and axial 2D true FISP with fat suppression (matrix 192 × 340; slice thickness 6 mm; gap 0 mm). Patients were then given 0.5 mL Buscopan® intravenous regardless of whether or not MRE was performed on the same day as CTE. After 0.2 mmol/Kg gadodiamide (Omniscan, GE Healthcare) was administered at 3 mL/s and a 45-s scanning delay, coronal 2D fast spoiled gradient-recalled echo (FSPGR) (TR 150 milliseconds; matrix 320 × 160; slice thickness 6 mm; gap 0 mm), coronal 3D liver acquisition volume acceleration (LAVA) (matrix 384 × 224; slice thickness 4 mm; gap 0 mm), and axial 3D LAVA (matrix 320 × 192; slice thickness 4 mm; gap 0 mm) sequences were performed. Parallel imaging was used for all contrast-enhanced sequences. All sequences were performed during breath-holding.
Imaging Findings
Maximum small bowel wall thickness was recorded in millimetres in three small bowel parts – duodenum, jejunum and ileum. Findings indicative of active inflammation on CTE included segmental mural hyperenhancement, increased wall thickness (>3 mm), or presence of extraluminal complication (sinus tract, fistula, abscess).8,9 On MRE, mural stratification, high T2 mural MR signal, and presence of the comb sign and mesenteric adenopathy were noted as signs of active disease.10,11
MRI Severity Index12
The quantitative findings and scores allotted to each parameter in this scoring system were as follows: wall thickness (<3 mm – 0, 3-4 mm – 1, >4 mm – 2), percentage wall enhancement (<70 – 0, 70-99 – 1, 100 – 2), percentage luminal stenosis (<50 – 0, 50-80 – 1, >80– 2). Amongst qualitative findings, score was 0 for absent and 1 for present. The following variables were studied: mucosal abnormality (ulcer, cobblestoning, mucosal irregularity),layered pattern of enhancement, mesenteric abnormalities (hyperemia, comb sign), pathologic lymphadenopathy (>10 mm, intense enhancement), fistulae, abscess and distensibility. MRI severity index was cumulative of all scores and was classified as: no activity: 0-1, mild activity: 2-6, severe activity: >7.
Statistical Analysis
Statistical analysis was done using Microsoft Excel 2007 (Microsoft, Washington, USA)and STATA software (version 10, Stata Corporation, Texas, USA). The primary objective was to determine whether CTE or MRE is better than the other. Sample size was not calculated prior.The secondary objective was to compare MR severity index with clinical disease activity, inflammatory markers and specific MRE features. The 95% exact binomial confidence intervals for these estimates were calculated. Biochemical parameters of inflammation were compared with MRI severity index using coefficient of correlation for paired values.
Results
Of the 29 patients (median age 43 years, standard deviation 15.36, range 18 to 70; 15 females) analysed, 14 had active disease and 15 were in remission,as defined by clinical features and inflammatory markers. Table 1 depicts demographic details of these patients: Age, sex, clinical disease activity, fecal calprotectin values and descriptive imaging findings.
CTE vs MRE comparative finding are mentioned in Table 2.
On CTE, normalfindings were noted in 14. In 15 patients Ileocolonic involvement was seen, 5 had additional small bowel involvement and two patients had strictures. Abnormal findings included wall thickening in 13 patients, increased mesenteric vascularity in 5.
On MRE, 19 patients showed definitive intestinal or vascular changes; 10 patients had normal MRE (Table 1). Of the 19 patients with abnormal findings, 13 showed long-segment involvement or concentric wall thickening. T2 hyperintensity was noted in 8 patients and mural stratification in four. Comb sign (or increased vascularity) was positive in 6 patients. MRE showed strictures in the two patients who had it on CTE, andidentified strictures in seven additional patients(p=0.04; Fischer 2x2 table).
Amongst patient who were in clinical remission, CTE and MRE had good agreement in assessment of disease activity on imaging. However, in patients who had active clinical disease – MRE identified 4 more cases with abnormal findings which were reported normal on CTE.(Table 3). In terms of additional pick up rate of active disease, MRE was about 14 percent better over CTE.
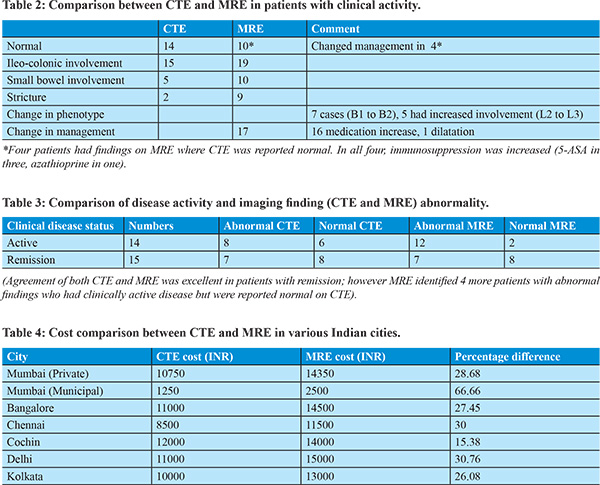
More interestingly, a phenotypic change was noted in twelve cases (41%) after MRE: based on Montreal classification, 7 patients had change in behaviour (non-stricturing to stricturing, B1 to B2) and 5 had change in location (colonic to ileo-colonic, L1 to L2). Amongst 17 patients, clinical management was altered based on abnormal findings on MRE (bowel wall T2 hyperintensity, increased vascularity) that were not seen on CTE, giving 58.6% absolute yield of MRE over CTE. In 16 patients, the dose of medications was increased (azathioprine in ten, 5-ASA in six patients); In one patient CTE showed stricture but MRE could identify it to be likely fibrotic – (no T2 hyperintensity, no increased vascularity) –needed endoscopic stricture dilatation.
There was significant correlation between MRI severity index and disease activity (r=0.70, p<0.0001; ANOVA) andfecalcalprotectin (r=0.52; p<0.003), but not CRP (r=0.03; p<0.1). On MRE, mural stratification, T2 hyperenhancement and comb sign correlated with disease activity (r=0.8, r=0.6 and r=0.5, respectively; p<0.002). On CTE, wall enhancement and comb sign correlated with disease activity (r=0.5 and 0.4 respectively; p<0.003). Median MR Index of severity for patients with Active disease was 6.5 versus 1 for patients in remission .
Cost comparison amongst the two modalities in various Indian cities is shown in table 4. The percentage change in costs between CTE and MRE amongst seven cities varied between 15 to 66 percent (with average of 32 percent, standard deviation 16 percent), MRE was costlier than CTE.
Discussion
Overall MRE was about 14 percent better at identifying abnormal radiologic findings compared to CTE, in clinically active patients with almost equal agreement in patients who are in clinical remission.Interestingly, our study showed that in 17 patients MRE changed management compared to CTE (additional yield of 58.6%).Based on CTE no patient had change in management.To our knowledge, no Indian study has compared MRE and CTE in IBD. We found that amongst CTE findings bowel wall thickness and increased mesenteric vascularity correlated best with disease activity. Amongst MRE findings, mural stratification, T2 hyperenhancement or mural stratification and comb sign correlated best with active Crohn’s disease. MRI severity index was confirmed to be a useful indicator of active clinical disease.
CT is more widely available and is less time-consuming than MRI. The diagnostic utility of CT in Crohn’s colitis was investigated in two studies.15,16 Sensitivity and specificity were compared with ileo-colonoscopy findings as gold standard;they ranged from 60% to 90% and 90% to 100%, respectively. MRI also provides useful information in colonic CD, although mild disease may not be detected. Per-patient analysis15,17-20 showed high sensitivity and specificity, ranging from 78% to 100% and 46% to 100%, respectively. A meta-analysis comparing the accuracies of ultrasonography, MRI, leukocyte isotope scintigraphy, CT, and positron emission tomography for diagnosis in patients with suspected or known inflammatory bowel disease (IBD), mainly CD, 21 concluded that the mean sensitivity estimates on a per-patient basis were high and not significantly different among the imaging modalities (90%, 93%, 88%, and 84% for US, MRI, leukocytescintigraphy and CT, respectively. Mean per-patient specificity estimates were 96% for ultrasonography, 93% for MRI, 85% for leukocyte scintigraphy, and 95% for CT. CT and MRI had similar diagnostic accuracy for imaging IBD.21 Although limited, data show thatMRE changed management in about 60% of cases.15 In our study, MRE changed management in 58% of cases.
The percentage change in cost between CTE and MRE ranged between 15 to 66 percent (with average of 32 percent, standard deviation 16 percent), MRE was costlier than CTE. The MRI severity index, which incorporates various qualitative and quantitative parameters, is an objective score to identify active inflammation. In the study by Girometti et al.,12 the MRI severity index had shown diagnostic accuracy of 91%, and sensitivity and specificity of 93% and 87%, respectively, in evaluation of active inflammation on MRE. In our study, we noted good correlation between the MRI severity index and clinical disease activity as well as inflammatory markers.
Earlier studies13 found that in the depiction of mural thickness and hyperenhancement, MRE was superior to CTE. In contrast, Schmidt et al.14 showed better inter-observer agreement and sensitivity for bowel wall thickening and enhancement on CTE when compared with MRE. In our study, MRE features of mural stratification and bowel wall T2 hyperintensity independently correlated with clinically active Crohn’s disease. As for CTE, bowel wall enhancement and comb sign had positive correlation with active CD.
Our study had limitations. Only twelve of our patients had undergone recent ileo-colonoscopy. In the rest, disease activity was based on clinical disease status and inflammatory biomarkers. Although studies have considered ileo-colonoscopy as the gold standard in ileo-colonic disease, this modality can obviously not assess disease activity in the rest of the small bowel.Secondly , the two modalities (CTE and MRE) were not performed on the same day in our study.
In summarywe found that MRE significantly diagnosed more strictures than CTE and also helped in management decision-making, in addition to identifying more patients with abnormal findings who are clinically active. This came at an additional cost of 32 percent more for MRE. The MRI severity correlated with disease activity and may be incorporated in clinical practice for follow up.
References
- Loftus EV Jr. Clinical epidemiology of inflammatory bowel disease: incidence, prevalence, and environmental influences. Gastroenterology. 2004;126:1504–1517.
- Assche G, Dignass A, Panes J, Beaugerie L, Karagiannis J, Allez M, et Al.and the European Crohn’s and Colitis Organisation (ECCO). The second European evidence-based consensus on the diagnosis and management of Crohn’s disease: Definitions and diagnosis. J Crohns Colitis. 2010; 4:7–27.
- Hafeez R, Punwani S, Boulos P, Bloom S, McCartney S, Halligan S, et al. Diagnostic and therapeutic impact of MR enterography in Crohn’s disease. ClinRadiol. 2011;66:1148–1158.
- Triantafillidis JK, Merikas E, Georgopoulos F. Current and emerging drugs for the treatment of inflammatory bowel disease. Drug Des DevelTher. 2011;6:185–210.
- Horsthuis K, Bipat S, Stokkers PC, Stoker J. Magnetic resonance imaging for evaluation of disease activity in Crohn’s disease: a systematic review. EurRadiol. 2009;19:1450–1460.
- Rimola J, Ordás I, Rodriguez S, García-Bosch O, Aceituno M, Llach J, et al. Magnetic resonance imaging for evaluation of Crohn’s disease: validation of parameters of severity and quantitative index of activity. Inflamm Bowel Dis. 2011;17:1759–1768.
- Michael J. Stewarda, ShonitPunwani, Ian Proctor, Yvette Adjei-Gyamfia, Fiona Chatterjeea, Stuart Bloom.Non-perforating small bowel Crohn’s disease assessed by MRI enterography: derivation and histopathological validation of an MR-based activity index. European Journal of Radiology 81 (2012) 2080–2088
- Schindera ST, Nelson RC, DeLong DM, Jaffe TA, Merkle EM, Paulson EK. Multi-detector row CT of the small bowel: peak enhancement temporal window – initial experience. Radiology.2007; 243:438–444.
- Herrmann K, Michaely HJ, Zech CJ, Seiderer J, Reiser MF, Schoenberg SO. Internal fistulas in Crohn disease: magnetic resonance enteroclysis. Abdom Imaging.2006;31:675–687.
- Rieber A, Aschoff A, Nüssle K, D. Wruk, R. Tomczak, M. Reinshagen. MRI in the diagnosis of small bowel disease: use of positive and negative oral contrast media in combination with enteroclysis. EurRadiol. 2000;10:1377–1382.
- Tolan DJ, Greenhalgh R, Zealley IA, Halligan S, Taylor SA. MR enterographic manifestations of small bowel Crohn disease. Radiographics. 2010;30:367-84.
- Girometti R, Zuiani C, Toso F, Brondani G, Sorrentino D, Avellini C, et al. MRI scoring system including dynamic motility evaluation in assessing the activity of Crohn’s disease of the terminal ileum. AcadRadiol. 2008;15:153-164.
- Low RN, Francis IR, Politoske D, Bennett M. Crohn’s disease evaluation: comparison of contrast-enhanced MR imaging and single-phase helical CT scanning. J MagnReson Imaging.2000;11:127–135.
- Schmidt S, Lepori D, Meuwly JY, Bertrand D, Reto M, Pierre M. et al. Prospective comparison of MR enteroclysis with multidetector spiral-CT enteroclysis: interobserver agreement and sensitivity by means of “sign-by-sign” correlation. EurRadiol.2003;13:1303–1311.
- Fiorino G, Bonifacio C, Peyrin-Biroulet L, Minuti F, Repici A, Spinelli A. et al. Prospective comparison of computed tomography enterography and magnetic resonance enterography for assessment of disease activity and complications in ileocolonic Crohn’s disease. Inflamm Bowel Dis. 2011;17:1073-1080.
- Andersen K, Vogt C, Blondin D, Beck A, Heinen W, Aurich V, et al. Multi-detector CT-colonography in inflammatory bowel disease: prospective analysis of CT-findings to high-resolution video colonoscopy. Eur J Radiol. 2006;58:140-146.
- Pilleul F, Godefroy C, Yzebe-Beziat D, Dugougeat-Pilleul F, Lachaux A, Valette PJ. Magnetic resonance imaging in Crohn’s disease. GastroenterolClin Biol. 2005;29:803-808.
- Miao YM, Koh DM, Amin Z, Healy JC, Chinn RJ, Zeegen R, et al. Ultrasound and magnetic resonance imaging assessment of active bowel segments in Crohn’s disease. ClinRadiol. 2002;57:913-918.
- Koh DM, Miao Y, Chinn RJ, Amin Z, Zeegen R, Westaby D, et al. MR imaging evaluation of the activity of Crohn’s disease. AJR Am J Roentgenol 2001;177:1325-1332.
- van Gemert-Horsthuis K, Florie J, Hommes DW, Lavini C, Reitsma JB, van Deventer SJ, et al. Feasibility of evaluating Crohn’s disease activity at 3.0 Tesla. J MagnReson Imaging. 2006;24:340-348.
- Horsthuis K, Bipat S, Bennink RJ, Stoker J. Inflammatory bowel disease diagnosed with US, MR, scintigraphy, and CT: meta-analysis of prospective studies. Radiology. 2008;247:64-79.