|
|
|
|
 |
|
| |
 |
|
|
Original Articles |
|
|
|
|
|
Keywords :
NAFLD, prevalence, rural , risk factors |
|
|
|
Lavekar Anurag*, Saoji Aniket***, Jadhav Shalik***, Lavekar Amarja**, Raje Dhananjay#, Jibhkate Sachin***
Dept. of Medicine*, and Radiology**,
Triveni Hospital, Nanded,
Dept. of Medicine***, NKPSIMS and
RC, Nagpur, Dept. of
Biostatistician#, MDS Bio-Analytics
Pvt. Ltd., Maharashtra, India
Corresponding Author:
Dr. Lavekar Anurag
Email: anuraglavekar@gmail.com
DOI:
http://dx.doi.org/10.7869/tg.241
Abstract
Background and aim: Nonalcoholic Fatty Liver Disease (NAFLD) is the most common cause of chronic liver diseases and hardly any studies have been reported about its prevalence from rural India. This study aims at assessing the prevalence of NAFLD rural sector from Maharashtra (India) and study the risk factors associated with the disease.
Methods: The study was conducted on 410 individuals from villages in the vicinity of Nanded town attending a tertiary care hospital; out of which 302 individuals were considered for analysis. Detailed history, physical examination, anthropometric measurements, laboratory investigations were done. Diagnosis of NAFLD was based on ultrasonographic findings.
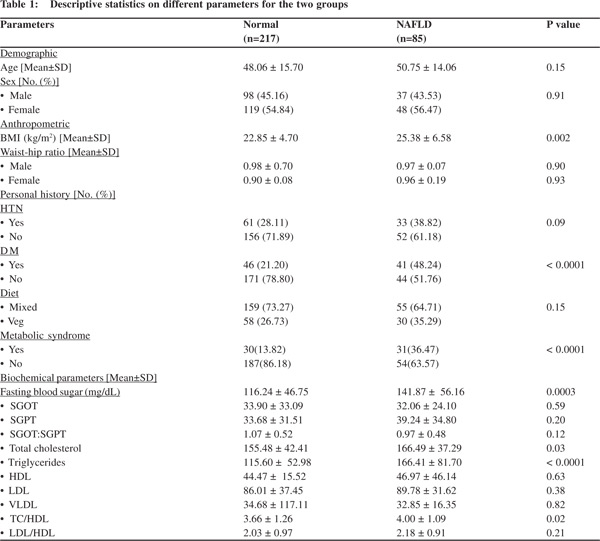
Results: Prevalence of NAFLD was found be 28.1 %. Mean BMI in NAFLD patients (25.38±6.58 kg/m2) was
significantly higher (p=0.002) than that of normal group (22.85±4.70 kg/m2). Metabolic syndrome and diabetes showed a significant association with NAFLD ( p< 0.0001). The biochemical investigations of fasting blood sugar (FBS), total cholesterol (TC), triglycerides (TG) and total cholesterol to high density lipoprotein ratio (TC/HDL) showed significant difference between the two groups.
Conclusion: Prevalence of NAFLD was found be 28.1%. Study confirms that the increased BMI, metabolic syndrome, increased fasting blood glucose and serum triglycerides are potentially strong indicators of NAFLD.
|
48uep6bbphidvals|699 48uep6bbph|2000F98CTab_Articles|Fulltext NAFLD is estimated to be the most common cause of chronic liver disease all over the world. NAFLD was recognized during the 1950s by Zelman and Westwater and Fainer.[1,2] However, it went relatively unnoticed on the presumption that NAFLD was a benign and non-progressive entity. Ludwig in 1980, coined the term ‘Nonalcoholic steatohepatitis’ (NASH) for alcohol-like liver disease that developed in persons who were nonalcoholic or not heavy drinkers (< 20 grams/day for men and < 10 grams/day for women)[3]. Fatty liver disease is defined as more than 5 % hepatocytes containing fat or more than 5 % of liver weight comprising fat[4]. NAFLDmaybe classified as primary and secondary. Primary NAFLD is usually due to insulin resistance and metabolic syndrome whereas secondary NAFLDis due to drugs, surgery, total parenteral nutrition, etc.[5]
NAFLD is basically a spectrum, which ranges from simple steatosis to steatohepatitis, cirrhosis of liver to hepatocellular carcinoma[6].
With the increased likelihood of risk factors such as obesity, diabetes mellitus (DM), metabolic syndrome and insulin resistance, the increased prevalence of NAFLD might have been predicted.[7,8,9] However, there is paucity of data regarding NAFLD from India and there is no uniformity in the populations studied. There are hardly any studies to assess the prevalence in the rural regionsof India. This study aims at assessing the prevalence of disease in rural areas of Maharashtra by targeting a small rural sector from south-east Maharashtra. It also aims at indentifying the potential risk factors associated with the disease in such a population.
Methods
This hospital-based cross-sectional study was conducted in one of the local hospitals from Nanded town, located in the southeastern region of Maharashtra. Mostly, residents from nearby villages around the city comprise the patient load at this center. For study purpose, we targeted healthy relatives of patients arriving during the period July 2013 to March 2014. Participants were informed about the study and accordingly written consent was taken. Clearance from the local ethics committee was obtained.
A total of 410 individuals were enrolled in the study. The individuals underwent detailed history evaluation, physical examination, anthropometric measurements, laboratory investigations and ultrasonologic examination of the abdomen. A history of diabetes mellitus (DM), hypertension was obtained. Individuals with any history of alcohol consumption were excluded from the study as the majority of occasional alcoholics failed to quantify the amount of alcohol intake, in addition to inconsistent frequency and change in alcohol type. Also, individuals on hepatotoxic drugs, and pregnant women were excluded from the study. Thus finally, 302 individuals were chosen for analysis.
Anthropometric measurements included height, weight, waist and hip circumference. BMI was calculated using Quetlet’s index. Waist circumference was considered abnormal, when it was > 90 cm for men and > 80 cm for women.[10,11] A BMI of 18.5 - 22.9 kg/m2 was considered normal, 23 -24.9 kg/m2, at risk of obesity and over 25 kg/m2, obese. Metabolic syndrome was defined as a waist circumference of> 90 cm for men and > 80 cm for women plus any two of the following: a) Blood pressure > 130/85 mm Hg b) Serum triglycerides > 150 mg/dL c) Serum HDL < 40 mg/dL for men and < 50 mg/dL for women d) Fasting blood sugar > 100mg/dL. Blood sample for fasting blood sugar and fasting lipid profile was collected following an overnight fast of 12 hours. Blood sample for post meal blood sugar level was collected two hours post-lunch. Fasting and post meal blood sugar levels were measured using Trinder’s method. HbA1c of individuals with elevated levels of either fasting blood sugar or post-meal blood sugar or both was performed using chromatography based HPLC assay. Serum bilirubin was measured by Diazo method of Pearlman and Lee. Aminotransferases were measured by modified IFCC method. Serum cholesterol was measured using CHOD – PAP endpoint method, HDL by Phosphotungstic acid method and triglycerides by GPO-Trinder method. HBsAg and anti-HCV were measured using screening methods.
USG abdomen was carried out by a single blinded radiologist using a TOSHIBA XARIO machine and 3.5 MHz convex probe for diagnosis of fatty liver. Ultrasonographic fatty liver was defined as a combination of liver-kidney contrast (bright liver) with vascular blurring and deep attenuation of ultrasound signals and used to classify hepatic steatosis. Hepatic steatosis was classified as Grade 1 (mild) – Normal visualization of diaphragm/ intrahepatic vessels, Grade 2 (moderate) – Impaired visualization of diaphragm/ intrahepatic vessels and Grade 3 (severe) – Poor visualization of diaphragm/ intrahepatic vessels.[12,13]
Statistical methods
In this study, data on demographic, anthropometric, personal history and biochemical parameters were obtained ineligible cases. Individuals were grouped into normal and NAFLD based on the diagnosis and the descriptive statistics obtained for each group. Continuous variables were summarized in terms of mean and standard deviation, whilst nominal variables were summarized as numbers and percentages. The statistical significance of difference in the means of continuous variables between two groups was evaluated using t-test for independent samples, while the significance of association between nominal variables with the disease was assessed using the Chi-square test. Also the statistics were obtained according to the grade of NAFLD. For continuous variables, the comparison of means across multiple groups was performed using one-way analysis of variance (ANOVA). The risk factors associated with the diseased condition were identified through unconditional logistic regression analysis by including significant biochemical parameters along with co-variates like age, sex, BMI, and personal history. The statistical significance was evaluated at 5% and the analysis was performed using SPSS Inc. 11.0 package.
Results
The study included 302 cases attending the healthcare hospital at Nanded, Maharashtra state, India. Of these cases, 85 were diagnosed with NAFLD, and the remainder normal (Table 1), thus resulting in a prevalence of 28.1%. The mean age of individuals in two groups did not differ significantly; also gender had insignificant association with disease occurrence. Mean BMI in NAFLD patients (25.38 ± 6.58 kg/m2) was significantly higher than that of the normal group (22.85 ± 4.70 kg/m2) with a P-value of 0.002. Diabetes showed highly significant association with NAFLD (P-value < 0.0001). Out of 87 diabetic cases, 41 (47.1%) had NAFLD, while amongst 215 non-diabetic cases, 44 (20.4%) had the disease. The presence of metabolic syndrome was also determined in two study groups. The proportion of individuals with metabolic syndrome in the normal group (13.82) was significantly lower than in the NAFLD group (36.47) with a P-value < 0.0001. The biochemical investigations revealed that fasting blood sugar (FBS), total cholesterol (TC), triglycerides (TG) and total cholesterol to high density lipoprotein ratio (TC/HDL) showed significant difference between the two groups. All these parameters had significantly higher means in the diseased group as compared to the normal group.
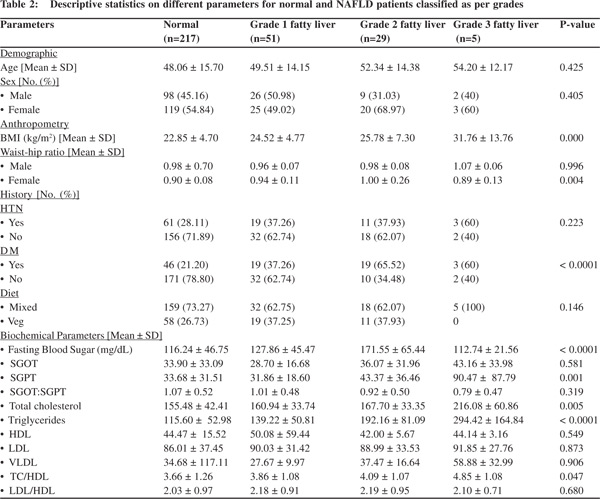
The diseased group was further segregated according to grade of NAFLD. Accordingly, the comparative analysis of different study parameters was carried out across four groups with the results shown in Table 2. The above parameters showed significant difference using one-way ANOVA, which was mainly contributed by the normal and the diseased group. However, in this analysis, ALT showed significant difference across groups (P-value: 0.001), which was mainly contributed by higher mean of 90.47 ± 87.79 U/L in Grade III NAFLD patients.
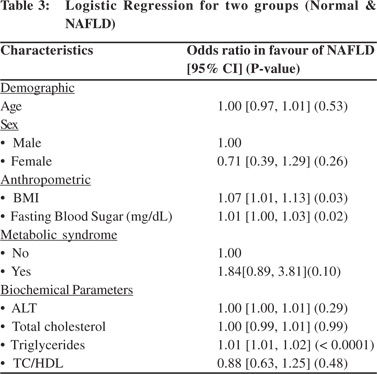
In order to determine the risk factors associated with NAFLD, multivariate logistic regression analysis was performed with age, sex, BMI, metabolic syndrome and significant biochemical parameters, as obtained through univariate analysis, in the model. The adjusted odds ratios for different parameters are shown in Table 3. The risk of disease was lower in female compared to male patients as indicated by an odds ratio of 0.71 [95% CI: 0.39 – 1.29]. Higher BMI increased the risk of NAFLD marginally [OR: 1.07; 95% CI: 1.01 – 1.13]. Higher sugar levels barely increased the risk of disease [OR: 1.01; 95% CI: 1.00 – 1.03]. The presence of metabolic syndrome increased the risk of NAFLD 1.84 times [95% CI: 0.89 – 3.81], while the biochemical parameters ALT, TC, TG, TC/HDL ratio showed ORs close to 1.00 indicating hardly any impact on the likelihood of disease
Discussion
Very few studies from rural India have attempted the estimation of NAFLD prevalence.[14] The overall prevalence of NAFLD in Asian countries ranges from 9% to 40%.[6] Our study reports the same range prevalence of NAFLD in rural population in the same range. In another study from rural areas in Tamil Nadu, nearly 18% were found to have NAFLD.[15] The prevalence was reported as slightly lower (8.7%) in a rural population based study, which was done on a larger sample size.[14] There is lack of uniformity in the populations studied and study designs. There are serious limitations in estimation of precise prevalence of NAFLD due to absence of clinical manifestations and lack of easily available, sensitive and noninvasive diagnostic modalities. NAFLD may have equal gender distribution or slight male preponderance and is prevalent in all age groups.[16] We reported similar findings as shown in Table 1. Few authors report male sex as an independent predictor of NAFLD.[15,17] Undisclosed alcohol abuse by men may be the possible explanation for higher prevalence of NAFLD amongst men in these studies. The mean BMI of patients with NAFLD in this study is 25.38±6.58kg/m2, which is significantly higher than individuals without NAFLD. Data from other studies also report comparable estimates.[7,18] However, the pattern of NAFLD in patients with central adiposity did not vary significantly from individuals without central adiposity in this study. Bajaj et al. have also found a poor association of central adiposity with NAFLD in Asian Indians.[19] This is contradictory to the findings by other authors.[7] As Asians are found to have increased tendency for intra abdominal fat deposition even with normal BMI and lower cut offs are recommended for defining central obesity in Indians, we were more interested in knowing whether increased waist circumference and waist to hip ratio is a risk factor for NAFLD.[20,21] It is increasingly believed that magnitude of adipose tissue dysfunction is more important than the severity of adiposity in conferring this risk.[19] NAFLD was also found significantly associated with metabolic syndrome in this present study, which is in unison with other studies.[7,22]
Increased fasting blood glucose levels, increased serum cholesterol and triglycerides emerged as important risk factors for the development of NAFLD (Table 1). This corroborates with previous other studies.[7,23-26] However, the presence of hypertension and serum ALT levels did not vary significantly among individuals with and without NAFLD. But, ALT levels increased sharply with the increase in grade of fatty liver (Table 2) in the present study. Similar trends are observed with BMI, fasting blood glucose levels and serum triglycerides (Table 2). As the total number of patients with grade 3 fatty liver is only 5, it is difficult to conclude definitively whether increase in quantity of these parameters correlates with the severity of NAFLD, which is one of the limitations of the study. A bigger sample size is needed to ascertain this.
Another important issue is of the diagnostic utility of ultrasonography in establishing the presence of fatty liver. The sensitivity of ultrasonography in detecting fatty liver ranges from 60 to 94% and also depends on the degree of steatosis.[5] Whereas, the magnetic resonance imaging provides an accurate and rapid assessment of hepatic steatosis to a lower limit of 3%, ultrasonography is not helpful for quantitative estimation of fat accumulation.[27] Also, it is observer dependent and there is significant intra- and inter-observer variability.[28,29] We have tried to overcome this limitation by providing a single observer. As both simple steatosis and steatohepatitis have the same picture on ultrasonography, it fails to differentiate between the two. Transient elastography (TE) is a noninvasive method of assessing liver fibrosis, which can be performed at the bedside or in the outpatient clinic. It employs ultrasoundbased technology to measure liver stiffness and has delivered good results in patients with NAFLD.[30] Liver biopsy still remains the gold standard investigation for diagnosis of NAFLD.
However, cost effectiveness, noninvasiveness and nonavailability of reliable biomarkers and other diagnostic modalities such as TE and MRI in rural setups makes ultrasonography the tool of choice for detection of fatty liver. A major limitation of the study is that it was conducted only in the south-eastern rural sector of Maharashtra on 302 patients, which may not be representative of the entire rural
population of the state. In view of the socio-economic and cultural diversity of rural Maharashtra, extensive research is required including different pockets of the state, region-wise, for a more realistic state of disease prevalence rate. To conclude, the present study demonstrates that the prevalence of NAFLD in the selected rural population is no different than that of urban population. It confirms the presence of risk factors such as: increased BMI, fasting blood glucose, and serum triglycerides, and the presence of metabolic syndrome in these patients. There is a compelling need for a reliable biomarker to differentiate hepatic steatosis from steatohepatitis. Ultrasonography remains the diagnostic tool of choice for detecting NAFLD in the rural setting even today.
References
- Zelman S. The liver in obesity. AMA Arch Intern Med. 1952;90:141–56.
- Westwater JO, Fainer D. Liver impairment in the obese. Gastroenterology. 1958;34:686–93.
- Ludwig J, Viggiano TR, McGill DB, Oh BJ. Nonalcoholic steatohepatitis: Mayo Clinic experience with a hitherto unnamed disease. Mayo Clin Proc.1980;55:434–8.
- Cairns SR, Peters TJ. Biochemical analysis of hepatic lipid in alcoholic and diabetic and control subjects. Clin Sci (Lond). 1983;65:645–52.
- AGA technical review on nonalcoholic fatty liver disease. Gastroenterology.2002;123:1705–25.
- Farrel GC, Larter CZ. Nonalcoholic fatty liver disease: from steatosis to cirrhosis. Hepatology. 2006;43:S99–S112.
- Amarapurkar D, Kamani P,Patel N, Gupte P, Kumar P, Agal S, et al.Prevalence of nonalcoholic fatty liver disease: a population based study. Ann hepatol. 2007;6:161–3.
- Mohan V, Deepa R. Adipocytokines and the expanding Indian Asian Phenotype. J Assoc Physicians Ind. 2006;54:685–6.
- Misra A, Vikram NK. Insulin resistance syndrome (metabolic syndrome) and Asian Indians. Current Science. 2002;83:1483–96.
- Farrell GC1, Chitturi S, Lau GK, Sollano JD; Asia-Pacific Working Party on NAFLD. Executive Summary Guidelines for the assessment and management of Nonalcoholic Fatty Liver Disease in the Asia-Pacific Region. J Gastroenterol Hepatol. 2007;22:775–7.
- WHO Expert Consultation. Appropriate body mass index for Asian population and its implications for policy and intervention strategies. Lancet. 2004;363:157–63.
- Hamer OW, Aguirre DA, Casola G, Lavine JE, Woenckhaus M, Sirlin CB. Fatty liver imaging and pitfalls. Radiographics. 2006;26:1637–53.
- Gore RM. Diffuse liver disease. In: Gore RM, Levine MS, Laufer I (Eds). Textbook of Gastrointestinal Radiology. Philadelphia: WB Saunders;1994:1968–2017.
- Das K, Das K, Mukherjee PS, Ghosh A, Ghosh S, Mridha AR, et al. Nonobese population in a developing country has a high prevalence of nonalcoholic fatty liver and significant liver disease. Hepatology.2010;51:1593–602.
- Pinidiyapathirage MJ1, Dassanayake AS, Rajindrajith S, Kalubowila U, Kato N, Wickremasinghe AR, et al. Nonalcoholic fatty liver disease in a rural,physically active, low income population in Sri Lanka. BMC Research Notes. 2011,4:513.
- Neuschwander –Tetri BA, Caldwell SH. Nonalcoholic steatohepatitis: summary of an AASLD single topic conference. Hepatology. 2003;37:1202–19.
- Park SH1, Jeon WK, Kim SH, Kim HJ, Park DI, Cho YK,et al.Prevalence and risk factors of non-alcoholic fatty liver disease among Korean adults. J Gastroenterol Hepatol. 2006,21:138–43.
- Madan K1, Batra Y, Gupta SD, Chander B, Rajan KD, Tewatia MS, et al. Nonalcoholic fatty liver may not be a severe disease at presentation among Asian Indians. World J Gastroenterol. 2006;12:3400–5.
- Bajaj S, Nigam P, Luthra A, Pandey RM, Kondal D, Bhatt SP, et al. A case control study on insulin resistance, metabolic co-variates and prediction score in non alcoholic fatty liver disease. Indian J Med Res. 2009;129:285–92.
- Misra A, Chowbey P, Makkar BM, Vikram NK, Wasir JS, Chadha D, et al. Consensus statement for diagnosis of obesity, abdominal obesity and the metabolic syndrome for Asian Indians and recommendations for physical activity, medical and surgical management. J Assoc Physicians India. 2009;57:163–70.
- Misra A, Vikram NK. Clinical and pathophysiological consequences of abdominal adiposity and abdominal adipose tissue depots. Nutrition.2003;19:457–66.
- Kumar R, Rastogi A, Sharma MK, Bhatia V, Garg H, Bihari C,et al Clinicopathological characteristics and metabolic profiles of non-alcoholic fatty liver disease in Indian patients with normal body. Indian J Endocrinol Metab. 2013;17:665–71.
- Gupte P, Amarapurkar D, Agal S, Baijal R, Kulshrestha P, Pramanik S, et al. Nonalcoholic steatohepatitis in type 2 diabetes mellitus. J Gastroenterol Hepatol 2004;19:854–8.
- Banerjee S, Ghosh US, Dutta S. Clinicopathological profile of hepatic involvement iin type-2 diabetes mellitus and its significance. J Assoc Physicians India. 2008;56:593–9.
- Duseja A, Das A, Das R, Dhiman RK, Chawla Y, Bhansali A,et al. Clinicopathological profile of Indian patients with nonalcoholic fatty liver disease is different from that in the west. Dig Dis Sci. 2007;52:2368–74.
- Duseja A, Das A, Dhiman RK, Chawla YK, Das R, Bhadada S,et al. Indian patients with nonalcoholic fatty liver disease presenting with raised transaminases are different presentation. World J Gastroenterol.2007;13:649–50.
- Davidson LE, Kuk JL, Church TS, Ross R. Protocol for measurement of liver fat by computed tomography. J Appl Physiol. 2006;100:864–8.
- Falck – Ytter Y, Younossi ZM, Marchesini G, McCullough AJ. Clinical features and natural history of nonalcoholic steatosis syndromes. Semin Liver Dis. 2001;21:17–26.
- Mishra P, Younossi ZM. Abdominal ultrasound for diagnosis of nonalcoholic fatty liver disease (NAFLD). AM J Gastroenterol. 2007;102:2216–7.
- Strauss S, Gavish E, Gottelib P, Katsnelson L. Interobserver and intraobserver variability in the sonographic assessment of fatty liver. AJR Am J Roentgenol. 2007;189:W320–3.
|
|
|
|
|
|